

MACD in Trading: How to Trade the Indicator on Pocket Option
18 September 2026
MACD (Moving Average Convergence/Divergence) is one of the most popular technical analysis indicators. It doesn't predict the future, but it's good at showing whether a price move is gaining strength and whether a reversal might be coming. Let's break down what this indicator is and how to work with it.
Below is a video walking through the MACD strategy on real trades in Pocket Option:
You can find video examples of the other strategies on the settings page.
What Is MACD
MACD shows the difference between two moving averages: a fast one (reacts to price almost instantly) and a slow one (smooths out fluctuations, reacts with a delay). When the fast average pulls ahead of the slow one, price is gaining upward momentum; when it falls behind, momentum is downward.
On the chart, MACD shows three elements: the MACD line itself (the difference between the fast and slow EMA, 12 and 26 periods by default), the signal line (a smoothed moving average of the MACD line, usually over 9 periods), and the histogram (the difference between the two). Growing histogram bars mean the move is strengthening, shrinking bars mean it's losing steam.
How to Read the Indicator
MACD has two key reference points:
- Signal line crossover. When the MACD line crosses the signal line from below, that's a potential buy signal; from above, a potential sell signal.
- The zero line. When MACD is above zero, the overall trend is upward; below zero, downward. Crossovers that happen right near zero occur where the trend hasn't really established itself yet, and they turn out to be noise more often.
Important to understand: a signal line crossover by itself isn't a guaranteed "sell" or "buy" signal – it's a cue to pay attention and check it against the overall trend direction.
Basic MACD Entry Strategy
1. Crossover confirmed by trend. Don't look at a signal line crossover in isolation – combine it with the indicator's position relative to zero: a crossover upward above zero is more reliable than the same crossover near zero.
2. Don't trade against a strong trend. In a strong move, MACD can stay above or below zero for a long time without a reverse crossover – that's normal behavior for the indicator in a trend, not a sign it's "broken."
3. Watch the histogram. If the histogram is shrinking while price is still rising, the move is losing strength even before the lines have a chance to cross – an early warning sign.
Example from the Pocket Option Interface
On the Pocket Option chart, open the indicators panel (the fx icon on the toolbar above the chart) and find MACD in the list. After adding it, a separate panel with the MACD line, the signal line, and the histogram appears below the price chart, and the period settings are available via the gear icon next to the indicator's name.
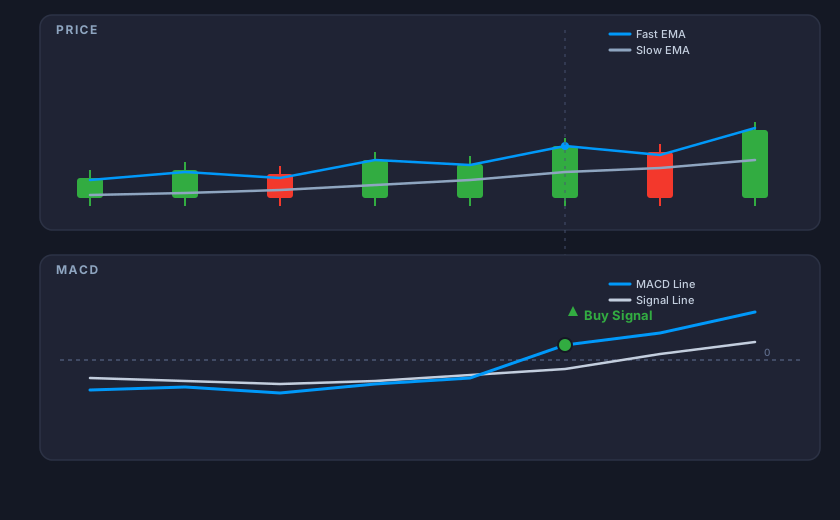
The asset's price rises for several candles in a row, and the fast and slow EMA on the price chart pull apart. On the MACD panel, the indicator line crosses the signal line from below, already sitting above the zero line. That's the entry point for an upward trade: the crossover is confirmed by the fact that it happened inside an already-established move, not near zero.
Common Mistakes
- Entering on every signal line crossover without checking the zero line – there are a lot of these near zero, and a good share of them are noise.
- Shrinking the periods for more frequent signals: the indicator gets more sensitive, but false signals increase noticeably too.
- Using MACD on a flat market with no clear trend – it's a trend-following indicator, and there will be few signals in a sideways market regardless of settings.
MACD and Automation
"Signal line crossover plus position relative to zero" is a clear, formalizable rule, which is why MACD is available as a ready-made preset in the Pocket Option Bot settings. The bot opens an upward trade when the MACD line crosses the signal line from below and is already above zero, and a downward trade when it crosses from above while already below zero. This zero-line filter cuts out signals near zero, where direction hasn't been established yet, and keeps only the crossovers confirmed by an already-formed move.
Other Strategies
See how the other strategies work:
Bottom Line
MACD is a clear, visual trend indicator, but it doesn't replace risk management and shows its weaker side in markets without a clear direction. As with any strategy, new settings should first be tested on a demo account before moving to a real deposit. Trading in financial markets always carries the risk of losing funds.