

Stochastic Oscillator in Trading: How to Trade the Indicator on Pocket Option
7 October 2026
The Stochastic Oscillator is one of the most popular indicators for spotting moments when a price move has run out of steam and a reversal is likely. It doesn't predict the future, but it shows well where the price sits relative to its recent range. Let's break down what this indicator is and how to work with it.
Below is a video with an example of trading the Stochastic Oscillator on real trades in Pocket Option:
You can find video examples of the other strategies on the settings page.
What Is the Stochastic Oscillator
The indicator is built on a simple idea: in a rising market the closing price usually stays near the top of the recent range, and in a falling market near the bottom. Stochastic shows where exactly within the range of the last candles the price closed, as a value from 0 to 100. The range is calculated from the highest high and lowest low over the chosen period, 14 candles by default.
On the chart, the indicator is drawn in a separate panel below the price and consists of two lines:
- The %K line – the main one, showing the price's position within the range (in smoothed form).
- The %D line – a moving average of %K, the "slow" signal line.
The classic settings are 14, 3, 3: the range period, the %K smoothing, and the %D smoothing. These are exactly the values the bot uses by default.
How to Read the Indicator
Stochastic has two key zones:
- Above 80: the asset is considered overbought, the price is near the top of the range, a downward correction is likely.
- Below 20: the asset is oversold, the price is near the bottom of the range, a bounce upward is likely.
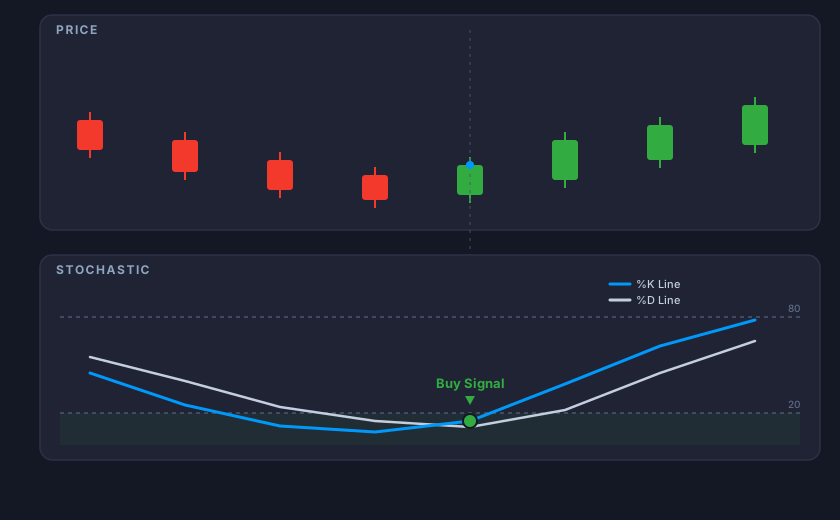
As with other oscillators, entering a zone by itself isn't a "sell" or "buy" signal. It's a cue to pay attention. The signal is the crossover of the lines: when %K crosses %D from below in the oversold zone, that's a potential entry upward; when it crosses from above in the overbought zone, a potential entry downward.
Basic Stochastic Entry Strategy
1. A crossover in an extreme zone. Wait for both lines to enter the zone above 80 or below 20, and enter after %K and %D cross. A crossover in the middle of the scale (around 50) is a weak signal, and such entries are more often noise.
2. Consider the overall trend. In a strong trend the indicator can stay in the overbought or oversold zone for a long time – that's not an anomaly but a sign of a strong move. Entering against such a trend just because 80 or 20 was touched is risky.
3. Combine with other signals. Stochastic works better together with support and resistance levels or a trend indicator such as MACD: the oscillator suggests the moment, the trend indicator the direction.
Example from the Pocket Option Interface
On the Pocket Option chart, open the indicators panel (the fx icon on the toolbar above the chart) and find Stochastic Oscillator in the list. After adding it, a separate panel with the %K and %D lines and the 20 and 80 levels appears below the price chart, and the periods are set via the gear icon next to the indicator's name.
The asset's price falls for several candles in a row, and both Stochastic lines drop below 20. Then the %K line turns and crosses %D from below, staying in the oversold zone. That's the entry point for an upward trade: the price has reached the bottom of the range, and the indicator has already shown a reversal.
Common Mistakes
- Entering as soon as the 80 or 20 level is touched, without waiting for the lines to cross: in a strong trend the price can keep moving for a long time.
- Using periods that are too short for more frequent signals: the oscillator gets jumpy and false signals increase noticeably.
- Trading against a strong trend based only on overbought or oversold readings.
- Using Stochastic as the only indicator without confirmation.
Stochastic and Automation
The rule "%K and %D crossover in an extreme zone" is clear and easy to formalize, which is why the Stochastic Oscillator is available as a ready-made preset in the Pocket Option Bot settings. The bot opens an upward trade when %K crosses %D from below and is under 20, and a downward trade when %K crosses %D from above and is over 80. The range and smoothing periods (14, 3 and 3 by default) can be changed in the strategy settings. The bot ignores crossovers in the middle of the scale, so there are fewer signals, but they belong to moments when the price is really at the edge of its range.
Bottom Line
The Stochastic Oscillator is a clear indicator for spotting reversals, but it performs worse in a strong trend and doesn't replace risk management. As with any strategy, new settings should first be tested on a demo account before moving to a real deposit. Trading in financial markets always carries the risk of losing funds.